-
Country Pages
-
Asia & the Pacific
- Afghanistan
- Bangladesh
- Bhutan
- Cambodia
- China
- India
- Indonesia
- Iran, Islamic Republic of
- Lao People's Democratic Republic
- Malaysia
- Maldives
- Mongolia
- Myanmar
- Nepal
- Pakistan
- Papua New Guinea
- Philippines
- Sri Lanka
- Thailand
- Timor-Leste
- Viet Nam
-
Eastern Europe & Central Asia
- Albania
- Armenia
- Azerbaijan
- Belarus
- Bosnia and Herzegovina
- Georgia
- Kazakhstan
- Kosovo Office
- Kyrgyzstan
- Moldova, Republic of
- North Macedonia
- Serbia
- Tajikistan
- Türkiye
- Turkmenistan
- Ukraine
- Uzbekistan
-
Arab States
- Algeria
- Djibouti
- Egypt
- Iraq
- Jordan
- Lebanon
- Libya
- Morocco
- Oman
- Palestine
- Somalia
- Sudan
- Syrian Arab Republic
- Tunisia
- Yemen
-
East & Southern Africa
- Angola
- Botswana
- Burundi
- Comoros
- Congo, the Democratic Republic of the
- Eritrea
- Eswatini
- Ethiopia
- Kenya
- Lesotho
- Madagascar
- Malawi
- Mauritius
- Mozambique
- Namibia
- Rwanda
- Seychelles
- South Africa
- South Sudan
- Tanzania, United Republic of
- Uganda
- Zambia
- Zimbabwe
-
Latin America & the Caribbean
- Argentina
- Bolivia, Plurinational State of
- Brazil
- Chile
- Colombia
- Costa Rica
- Cuba
- Dominican Republic
- Ecuador
- El Salvador
- Guatemala
- Haiti
- Honduras
- Mexico
- Nicaragua
- Panama
- Paraguay
- Peru
- Uruguay
- Venezuela, Bolivarian Republic of
- Caribbean (multi-country)
-
West & Central Africa
- Benin
- Burkina Faso
- Cabo Verde
- Cameroon
- Central African Republic
- Chad
- Congo
- Côte d'Ivoire
- Equatorial Guinea
- Gabon
- Gambia
- Ghana
- Guinea
- Guinea-Bissau
- Liberia
- Mali
- Mauritania
- Niger
- Nigeria
- Sao Tome and Principe
- Senegal
- Sierra Leone
- Togo
-
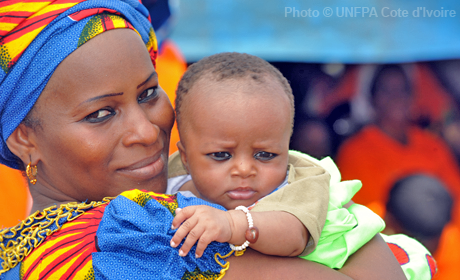
UNFPA Cote D'Ivoire
With a recent history of conflict, Côte d'Ivoire has some of the highest rates of population growth and maternal mortality in sub-Saharan Africa. Almost half its citizens live in poverty. Since 1972, UNFPA has supported measures to improve living conditions, including through national censuses to identify development needs. It has helped enact national population, reproductive health, and gender equality policies. Current assistance aims to increase the provision and use of quality reproductive health services, including family planning, and greater national capabilities to operationalize population and gender equality policies.
Population
 Population aged 0-14
 Population aged 15-64
 Population aged 65+
Sexual and reproductive health
 Births attended by skilled health personnel
Family Planning
 Modern method
Education
Gender, Rights, and Human Capital
Harmful Practices
Population Pyramid
Life Expectancy
Total fertility rate
News

Prevention, treatment, reintegration and advocacy: How UNFPA and partners work to end obstetric fistula
UNITED NATIONS, New York – According to an African proverb, “the sun should not rise or set twice on a labouring woman”.

Safe haven for girls living on the streets of Côte d'Ivoire
AD’s* nightmare began when her parents died. “My uncle decided to marry me off against my will. I refused and ran away…
Social Updates
Tweets from UNFPATürkiye